Viewing Data on Search Map
The Search Map presents you with a single, global view of all available data— Layers, Targets, Reports, and RFIs —on an interactive virtual globe. By default, all available Layers, Targets, Reports, and RFIs data types are turned off by default and the Timeline filter is set to the last 24 hours.
To get started with Search Map, do the following:
- Turn on your preferred map view by toggling map view.
- Simplify the display by toggling all or only the data types relevant to your task.
- Click and drill into the details about specific data types
- Focus on specific historical timeframes with the All Time or Custom filters.
- Quickly understand what’s happening right now using recent time filters namely last 24 hours, last 48 hours, or last 72 hours.
Key Viewing Options
-
Changing Map Perspective
Switch between Globe View and Perspective View for a more suitable analysis context. -
Focusing by Time
Use timeline filters to narrow down the data you see by recent activity (last 24/48/72 hours), available historical years, or a custom date range. -
Focusing by Data Type
Toggle different categories of data—such as Layers, Targets, Reports, or RFIs—on or off to control what is displayed. -
Interacting with Data Points
Click a data point on the map to a open dialog box. This dialog box provides details, metadata, coordinates, and options to access modules related to the data point (for example, Target Manager or Workspace).
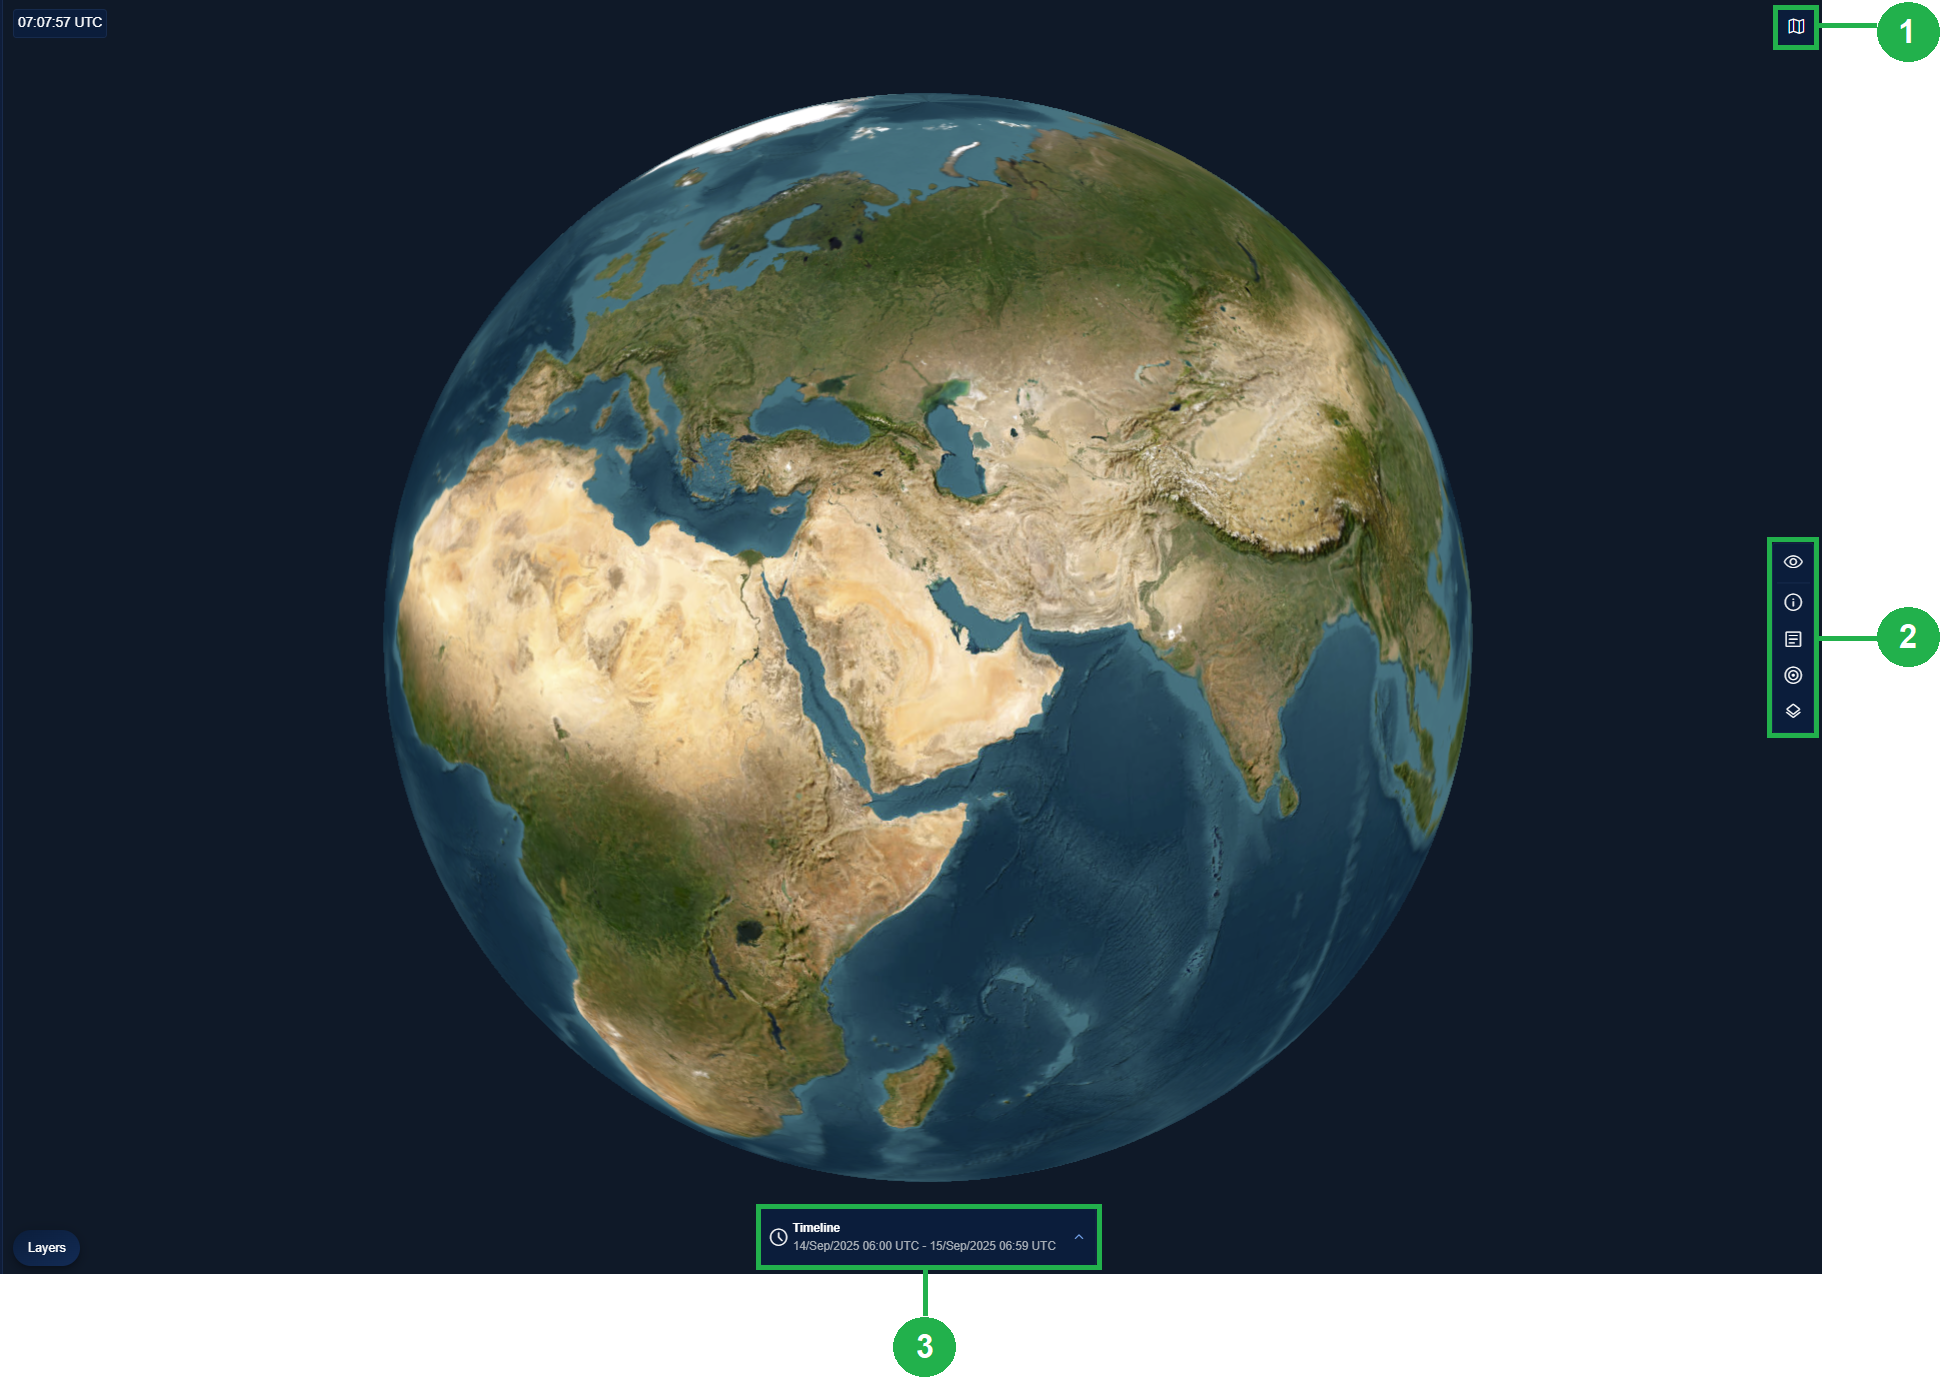
Search Map Page Layout
When you open the Search Map page, you see the following:
| # | Component | Description |
|---|---|---|
| 1 | Toggle Map View | Click to toggle map view - glove or perspective view. |
| 2 | Toggle Data Types | Click the Eye icon to toggle data types or click individual data types to view on map. |
| 3 | Timeline | Click to open Timeline filter. |
Viewing Data Changing Map Perspective
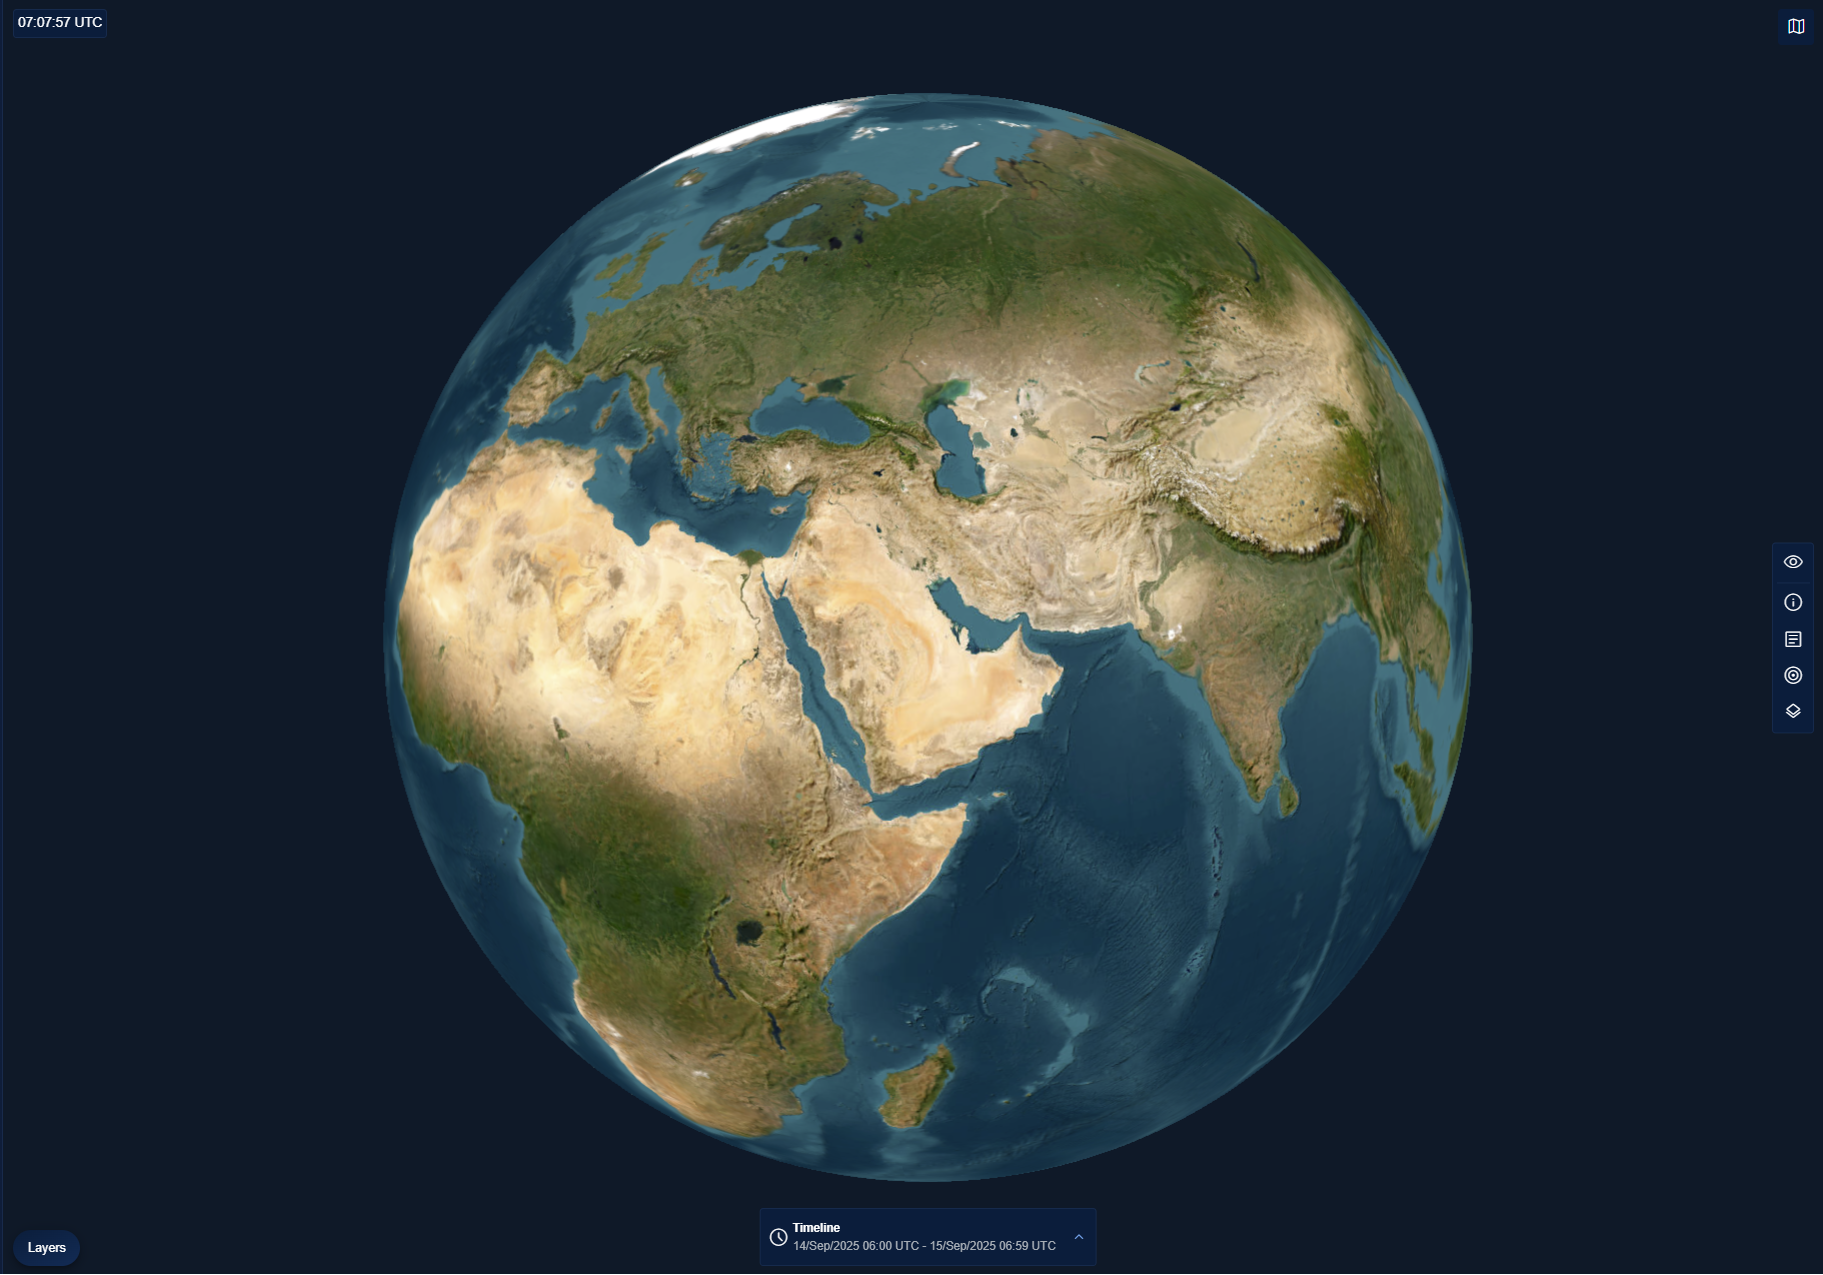
The Search Map provides two perspectives:
- Globe View – Displays 3D visualization of the globe.
- Perspective View – Displays a 2D visualization of the globe.
When to Use Each Perspective
Mostly it depends on the preferred way of viewing a map in the organization.
- Use Globe View for global situational awareness.
- Use Perspective View for analyzing activity within a specific area.
How to Switch
Click the Map View toggle button to switch between Globe View and Perspective View instantly.
Viewing Data
In this section, you will learn how to view data on the map.
To view data on search map, do the following:
-
Log in to the platform.
-
Click the Globes module, and then click the Search Map module.
The Search Map page is displayed.
The Search Map page is displayed.
-
On the Search Map page, toggle between the Globe View and Perspective View depending on your preference.
Viewing All or Individual Data Types on the Map
- Do one of the following:
-
Click the Eye icon to turn on or turn off the visibility of all the data types.
OR
-
Select any one of the data type and then proceed to select or clear the sub-types of the data (optional).

-
Viewing Data across the Years
- Click the Timeline filter and do one of the following:
-
Click the Years drop-down list and the select a year to view data from that particular year.

-
Viewing Data of Last Week, Last Month, or Last Year
- Click the Last Week drop-down list and select one of Last Week, Last Month, or Last Year options to view data from that last week, last month, or last year.
-
Additionally you can also adjust the slider of the secondary timeline to specify a time-frame from last week, last month, or last year.

-
Viewing Data of Last 24 hours, 48 hours, or 72 hours
- Click the Last 24h drop-down list and select one of 24h, 48h, or 72h options to to view data from that last 24 hours, 48 hours, or 72 hours.
-
Additionally you can also adjust the slider of the secondary timeline to specify a time-frame from last 24 hours, 48 hours, or 72 hours.
-
Viewing Data of All Time
- Click the All Time button to view all available data in your organization’s history, from the earliest recorded year through the present.
-
Adjust the primary and secondary timeline sliders to specific a a time-frame from specific time frame in years.

-
Viewing Data by Custom Date
-
Click the Custom button to set a Start Date and End Date to view data within this time frame.

When to Use Which Viewing Options?
| Timeline Option | When to Use This Option |
|---|---|
| Years | - To focus on all data from a specific calendar year. - To investigate a historical event tied to a particular year. |
| Last Week / Last Month / Last Year | - To review short-term to mid-term activity beyond the last 72 hours. - To assess weekly, monthly, or yearly patterns at a higher level. - To summarize activity for reporting periods commonly used by teams and leadership. |
| Last 24/48/72 Hours | - To check for very recent changes across your area of interest. - To identify activity trends over the last 1–3 days. - To ensure nothing critical has been missed in the most recent timeframe. |
| All Time | - To analyze historical patterns over decades. - To compare data availability across years. - To identify long-term activity trends. |
| Custom Date Range | - To isolate activity within a specific project timeline. - To investigate a time-sensitive incident. . |